
The question of what to do with it in your portfolio is critical. Arguments in favour of applying a systematic hedge to neutralise the rand’s impact have almost exclusively hinged on it reducing overall volatility (few seek shielding from long-term rand strengthening) – which seems perfectly plausible. Remove currency risk to reduce volatility.
The data, however, does not support this and suggests the opposite: rand hedging reduces returns and increases volatility. We unpack this unintuitive conclusion below.
The Volatility Paradox
What is currency hedging? Very simply, by using options, futures, or forward instruments we can neutralise rand movement in our portfolio.
When investing in global securities (e.g., the MSCI ACWI) our return profile looks as follows:

The rand can then either appreciate (negative return – meaning hedging improves portfolio returns in ZAR) or depreciate (positive return – meaning hedging reduces portfolio returns in ZAR). Returns are linear and additive – making it easy to understand.
Things, however, get more complicated when considering portfolio volatility – mostly the key motivation for systematic hedging. Volatility is non-linear, meaning the interactions between variables matter. Unlike returns where adding a negative returning asset reduces overall returns, adding a highly volatile asset to your portfolio can actually serve to reduce overall volatility. This happens when its movements generally offset that of others in the portfolio, similar to how headphones cancel noise (by creating waves that offset incoming sound waves).
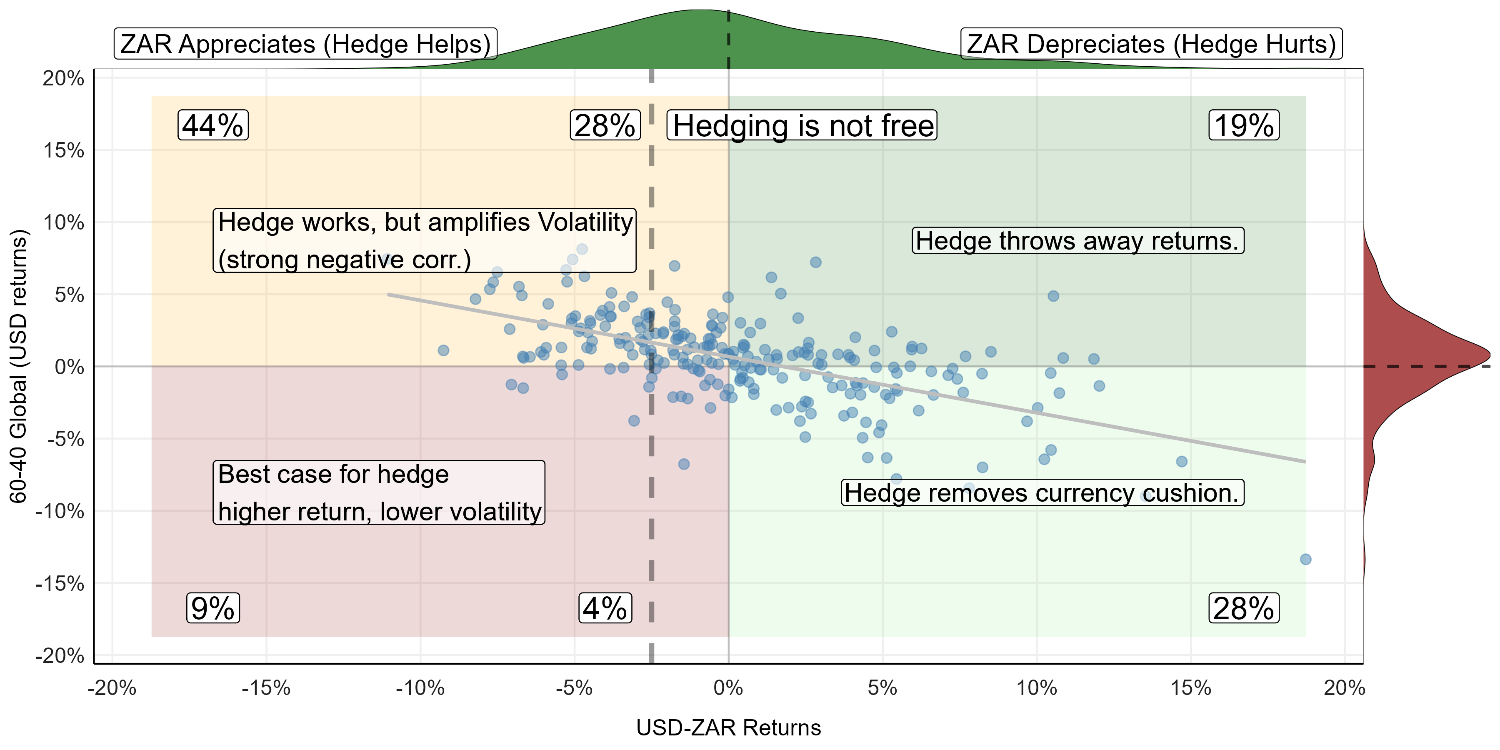
Exactly how has hedging impacted portfolio returns and variability in the past? To answer this, consider a simple balanced fund: a 60/40 allocation to equities and bonds, with a 70/30 split between local and global assets, rebalanced every quarter.[1] The offshore component of our 60/40 : 70/30 portfolio in USD has historically been strongly negatively correlated with the rand / USD exchange. The following graph summarizes this (global 60/40 USD returns on the Y-axis, ZAR/USD on the X-axis).
[1] This translates to a 42% allocation to FTSE/JSE All Share equities Index, 28% to the FTSE/JSE All Bond Index, 12% to the Bloomberg Global Aggregate Bond Index, 18% to the MSCI ACWI Equities Index
Source: Bloomberg. Calculation Satrix. (31 December 2004 – 31 January 2023).
The above shows a strong negative correlation between global returns and the rand (grey line). This makes sense, as the same global factors underpinning global asset returns also influence the rand. Amongst other, positive risk sentiment tends to favour both (and vice versa).
The quadrants above also show that the rand mostly serves to either cushion off-shore losses (bottom right) or amplify the off-shore returns (top right). The best case for hedging only happened 4% of the time after conservative costs (bottom left) over the past 20 years – while shielding from rand strength happen at the cost of higher volatility in the top left. Most important though is that the currency has a long right tail – meaning the rand tends to weaken more deeply than it strengthens. This important buffer is removed when we hedge the currency.
Below we look at our 60/40 : 70/30 portfolio return (in ZAR) on a rolling 1-year basis since 2004. Compared to a perfect and costless fully hedged alternative[2], the unhedged portfolio outperforms two thirds of the time (green shading).
[2] A real-world hedging strategy is not costless nor perfect, making these numbers a best case for hedging.
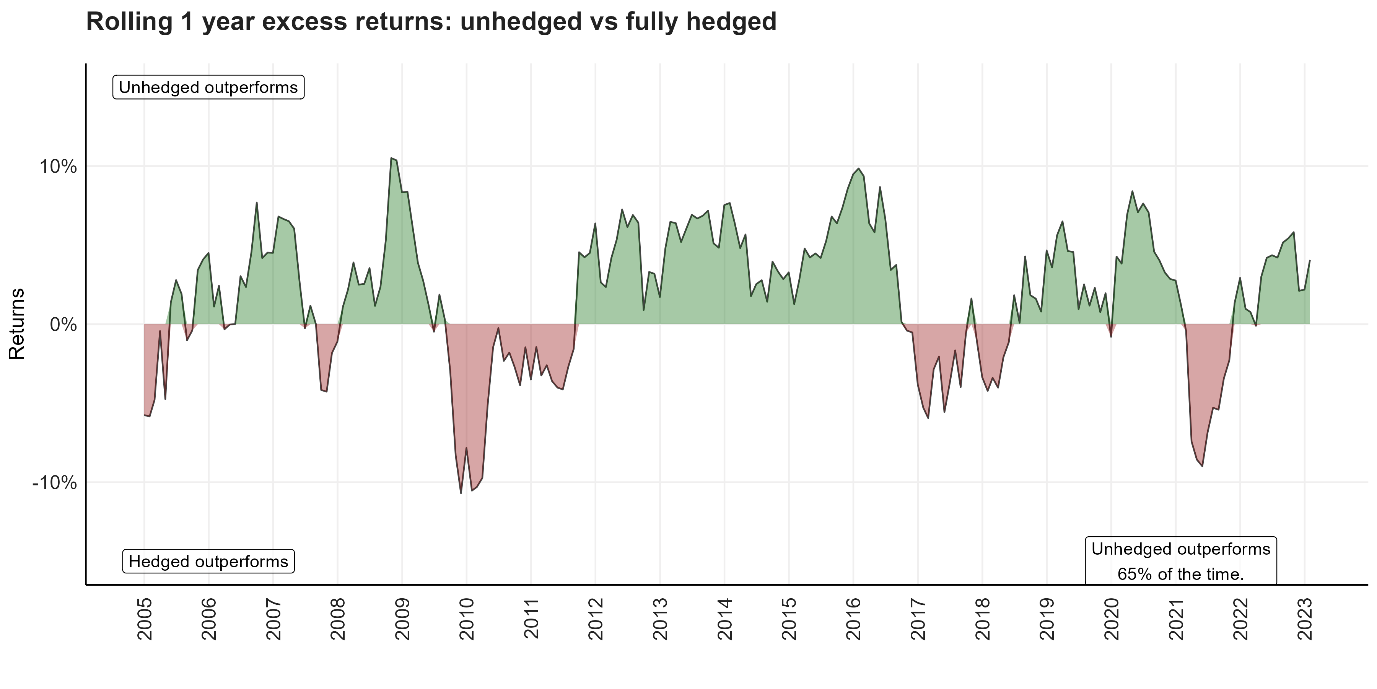
Source: Bloomberg. Calculation Satrix. (31 December 2004 – 31 January 2023).
What about tactical (short-term) currency hedging? Adding value is still complicated – even if an analyst were to correctly predict USD strength / weakness (arguably a simpler task).
Below we truncate the past 20 years into periods where the US Dollar Index (DXY) strengthened (likely that rand weakened: meaning the hedge hurt) and where the dollar weakened (likely that rand strengthened: meaning the hedge helped). Since 2004 – the unhedged portfolio nearly always outperformed when the USD strengthened (as expected), but when the USD weakened it was a literal coin-toss. This is well summarized in the following graph.
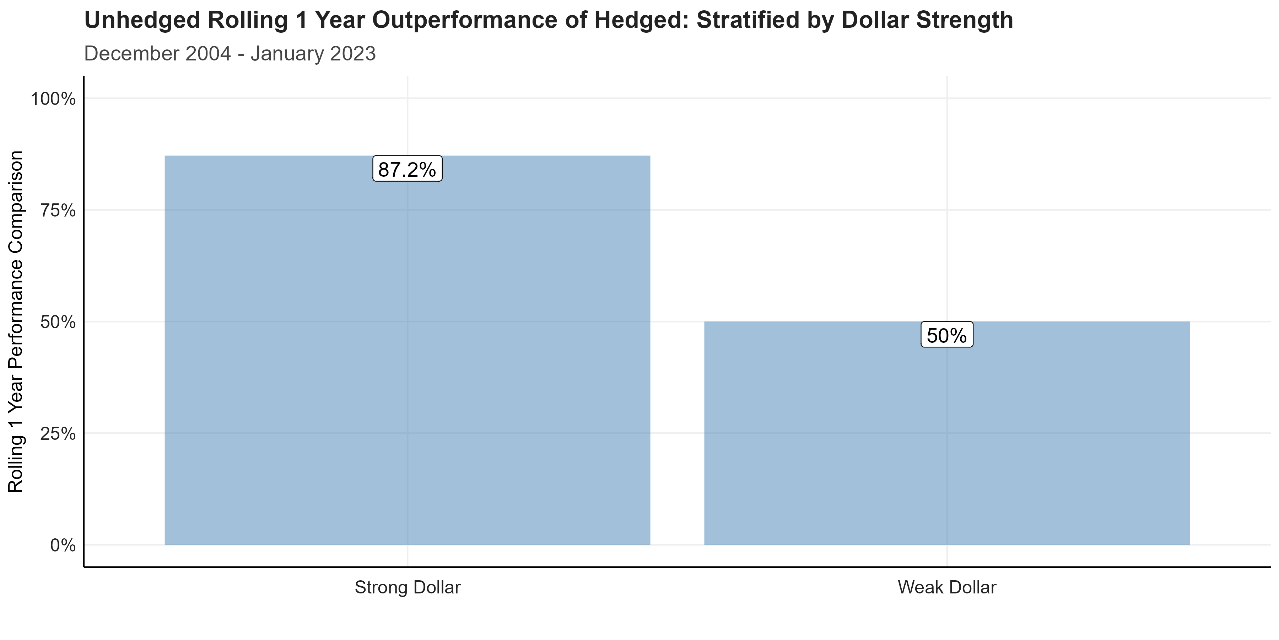
Source: Bloomberg. Calculation Satrix. (31 December 2004 – 31 January 2023).
Interpreting the above graph is simple: Heads Unhedged wins. Tails we toss again. Not great odds to expose clients’ portfolios to, even if we were able to predict future dollar strength / weakness.
Finally, the argument for hedging mostly hinges on it reducing portfolio volatility. But this too has no empirical support. Below we show the rolling volatility of our 60/40 : 70/30 balanced portfolio. It shows that neutralizing the rand through hedging increases volatility almost 70% of the time (with deeper drawdowns), despite the rand’s own inherent volatility.
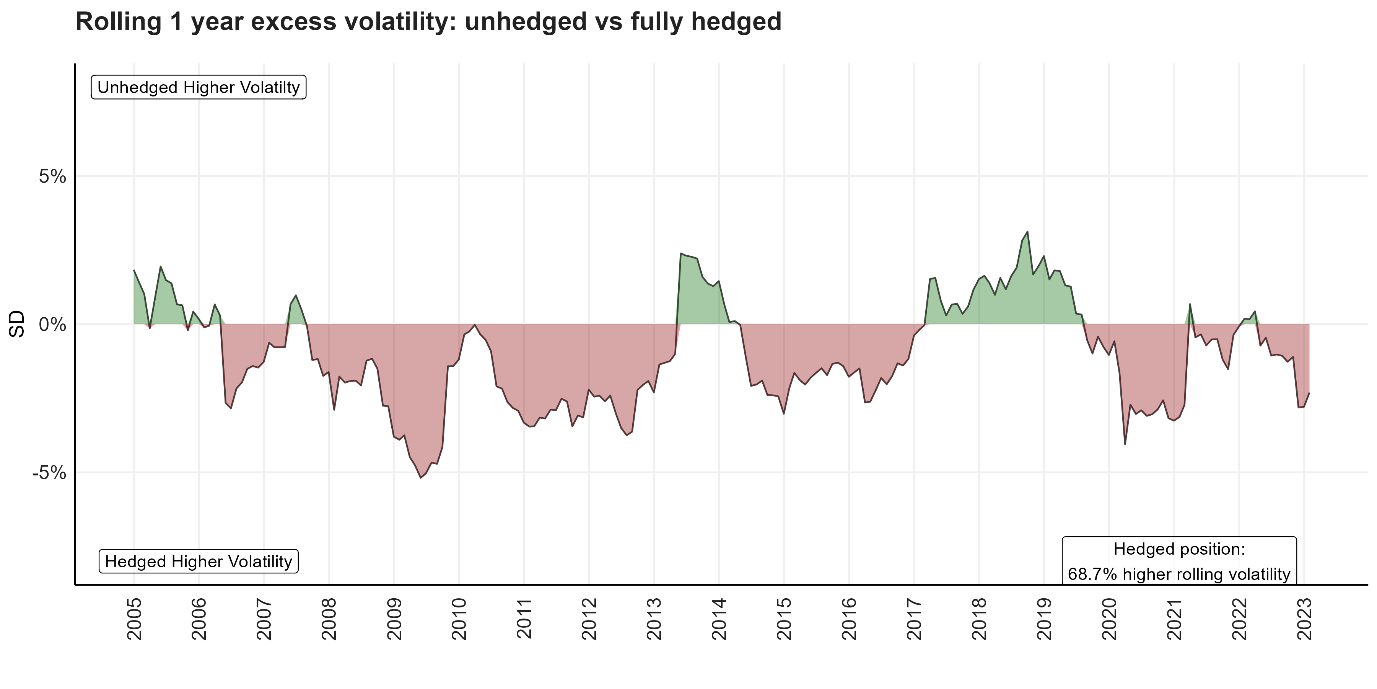
Source: Bloomberg. Calculation Satrix. (31 December 2004 – 31 January 2023).
In summary then:
Currency hedging applied tactically can add value and reduce volatility if timed well – although this carries the risk of rand weakness failing to cushion off-shore losses (as experienced acutely in 2022).
Currency hedging applied systematically (long-term, as a rule) to reduce portfolio volatility does not carry the weight of empirical validation. This stresses the importance of not trusting simple intuition when faced with non-linear complexities.
Disclosure
Satrix Investments (Pty) Ltd is an approved FSP in term of the Financial Advisory and Intermediary Services Act (FAIS). The information does not constitute advice as contemplated in FAIS. Use or rely on this information at your own risk. Consult your Financial Adviser before making an investment decision.
While every effort has been made to ensure the reasonableness and accuracy of the information contained in this document (“the information”), the FSP’s, its shareholders, subsidiaries, clients, agents, officers and employees do not make any representations or warranties regarding the accuracy or suitability of the information and shall not be held responsible and disclaims all liability for any loss, liability and damage whatsoever suffered as a result of or which may be attributable, directly or indirectly, to any use of or reliance upon the information.
Related Content
1 April 2025
Podcast: Navigating Market Bumps: Why Time in the Market Beats Market Timing

In the latest Ghost Stories podcast, Kingsley Williams of Satrix discusses the importance of long-term investing, market corrections, and strategic asset allocation for navigating volatility in 2025.
26 March 2025
Caution: Potholes Ahead!

The principle is simple: riskier asset classes should be held for longer periods to pay off. In the short term, they are more volatile, but over time, their value should align more with fundamentals. Higher returns for taking on more risk make sense in the long run.