By Nico Katzke, Satrix
The time to reflect on a forgettable year in global markets is fast running out – in fact, some might say it has passed already. We want to take the last opportunity available to look back and ask: “What worked, what didn’t, and what have we learned?”
Looking back
It should come as no surprise that few global indexes were spared pain in 2022, with sharp corrections and heightened volatility being the norm. The VIX Volatility index, frequently referred to as the global “fear gauge” (essentially aggregating insurance premiums for equity market corrections, known as implied volatility), had a median value only eclipsed in 2009 and the Covid-pandemic-hit 2020 over the past few decades, while the US Dollar strength index (DXY) reached its highest level in September – buoyed by both fear and FOMO (fear of missing out), as capital flowed into the world’s reserve currency on the back of geopolitical tensions and a US Federal Reserve (Fed) raising yields aggressively.
In a year where geopolitical tensions spilled over into armed conflict directly challenging Western democratic ideals and causing severe energy market disruptions, and with environmental and pandemic issues intensely debated among world leaders, it seems odd to say that the tail that firmly wagged the dog last year was inflation. Many would argue that it should never have been a surprise following more than a decade of historically accommodative monetary policies, but the sheer scale of price rises and coordinated central bank reactions shook markets. The preeminent global tech play, the Nasdaq-100 index, receded by 32.4%, the S&P 500 was down 18.1%, the Nikkei was down 18.5%, the Australian (-7.32%), French (‑12.2%), Korean (-28.6%) and Taiwanese (-26.9%) market indexes all closed down sharply; and the MSCI Emerging Markets (-20%), China (-21.8%), Growth (-29.1%) and Momentum (-17.4%) indexes all fell precipitously (returns calculated in US dollars, assuming gross dividends reinvested). Even traditional safe-haven assets were not spared, with the Global Aggregate Bond index down 16%, and gold being flat for the year (-0.2%) and, somewhat surprisingly, even losing its shine since Russia invaded Ukraine (down 11% since its March peak).
Why the pain?
But why would unexpectedly high inflation levels be a catalyst for such a severe coordinated asset market sell-off? This may seem counter-intuitive considering that higher inflation should, all things equal, raise the nominal value of the companies selling those same goods and services. But such a simple heuristic ignores the key temporal element for how assets are priced: current valuations discount future earnings and cash flow. This means that higher inflation expectations and commensurate interest rate hikes in the future, imply that tomorrow’s earnings are valued lower in today’s terms (being discounted at a steeper rate).
But just how steep did discount rates rise? Consider the fact that as we entered 2022, the federal funds rate in the US, a key anchor for developed market interest rates, was a mere 0.25%. By the end of the year, it had reached 4.5%. This prompted most other central banks, the South African Reserve Bank included, to follow suit and aggressively raise rates to slow consumer spending and inflation.
To understand which market indexes were most affected and why, consider the classic dichotomy of Growth vs Value shares. Growth companies or industries tend to have loftier valuations because of higher future earnings potential. This follows for the same reason some pay eyewatering premiums for houses in a sought-after estate ‒ hoping a high price today might look cheap tomorrow. Value companies tend to have more muted (some might even say grounded) earnings expectations, and are often associated with larger, more established and slower-growth blue-chip companies. An investment in Coca-Cola won’t double in value in a year; Apple or Amazon just might.
Understanding this distinction helps understand why pain occurred so acutely in equity markets in 2022. The MSCI All Country World index (ACWI) (comprising of nearly 3 000 global companies) is an often-used proxy for global equity market performance. The index composition has, over time, begun reflecting a decade-long preference for growth companies that coincided with low global rates and low inflation (technology and IT consumer services companies still dominate the index despite significant losses in 2022, comprising more than a quarter of the index today). Low interest rates since 2010 simply meant lower future earnings discount rates, meaning companies with higher growth potential were valued more favourably; low inflation meant less urgency to materialise these expectations. Even the traditionally industrial-heavy S&P 500 index has effectively become a tech-heavy growth proxy today. In truth, why back the tortoise (Coca-Cola) when you can bet on the hare (the next Apple or Amazon)?
This all came undone spectacularly in the perfect storm that was 2022. As global inflation spiked, the Fed kicked off a historically aggressive cycle of coordinated global tightening causing future discount rates to soar. Higher expected future inflation created a renewed sense of urgency to deliver on lofty earnings promises; heavily indebted growth companies, hoping to leverage their potential in a low-rate environment, faced real solvency risks; and higher discount rates made previously attractive valuations seem excessive. All in the space of a year.
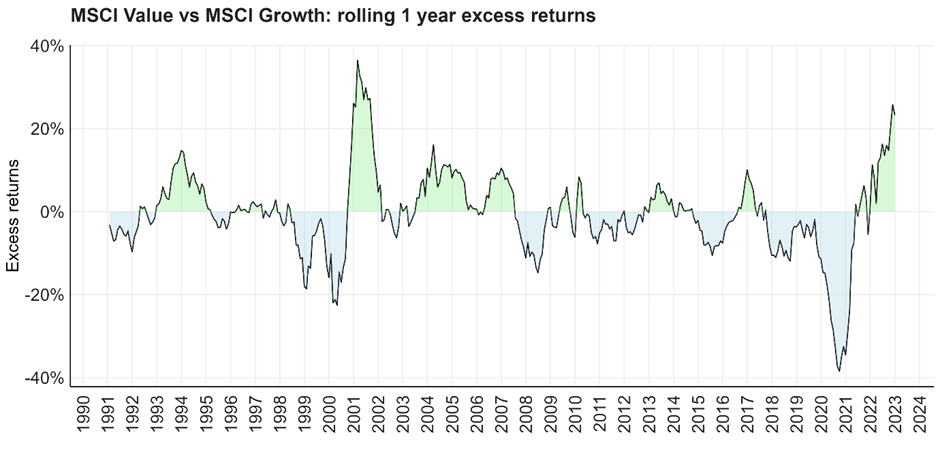
By contrast, Value strategies and industries performed strongly. As at the end of 2022, the MSCI Value to MSCI Growth index spread reached its highest level since the dotcom crash in the early 2000s, following a decade of underperforming Value strategies.
Source: MSCI. Calculation Satrix
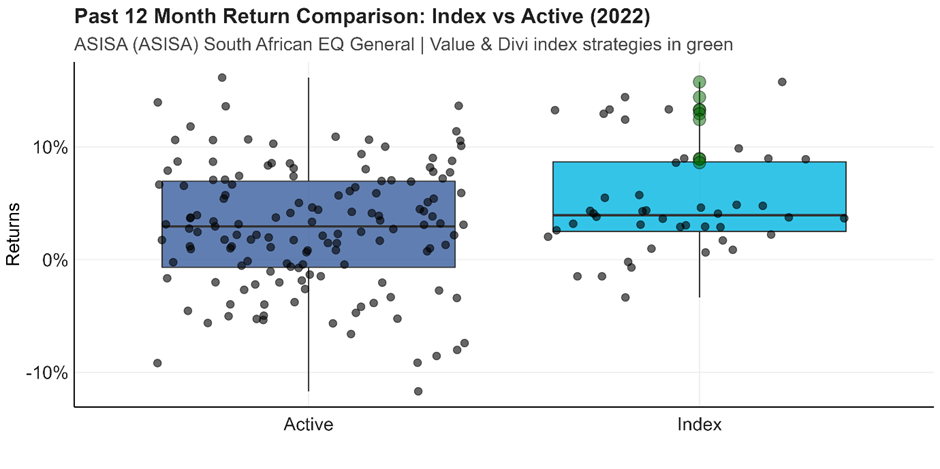
Locally, we’ve seen the same. Value managers broadly outperformed their active peers, while in the rules-based indexation segment we saw Value-oriented ETF and index funds comfortably outshine other retail strategies (highlighted in green):
Source: Morningstar. Calculation Satrix. Box plot indicates the top and bottom quartile of performers, with the black middle inner line the median performance.
What have we learned?
Investors should take at least two important lessons from 2022.
First, the importance of healthy diversification across both asset classes and investment styles. While the MSCI ACWI holds 3 000 companies, it is less diversified than you might think. It has become surprisingly susceptible to changing investor risk appetite, which caused a coordinated sell-off in growth strategies. The same applies to other large, trusted global indexes like the S&P 500, Nikkei and FTSE 100, which have become Growth-oriented strategies. Investors would be wise to consider adding more diversified sources of return to their portfolios, not simply more sources.
Second, 2022 was particularly challenging for local balanced fund managers. Regulatory changes allowed multi-managers to increase their funds’ offshore exposure (Regulation 28 changes allowed up to 45% offshore exposure). In response, many chose to down-weight local equity market exposure (with the FTSE/JSE All Share index closing down a mere 2.8% in US dollars) to move assets offshore. Managers who made use of rand hedges would have also been doubly hurt, as the weaker rand (down just over 6% to the dollar) would have offset some of the offshore losses. This isn’t a one-off though. Our research shows that over the last 20 years a fully hedged 60/40 equity and bond portfolio (with 70% local and 30% offshore exposure) underperformed the unhedged alternative 72% of the time on a rolling one-year basis, while having a higher realised volatility 61.4% of the time (which is somewhat surprising given the rand’s volatility). The lesson learnt is that increasing offshore exposure at all cost is not necessarily wise, while hedging currency exposure does not necessarily increase portfolio efficiency.
What happens next?
A tantalising question looking ahead is whether Value will continue to dominate Growth strategies in 2023 ‒ momentum is arguably less interesting, as it can be considered somewhat of a chameleon style; strong performance in Value means you now hold more Value counters today. Even if one does not follow a strict style approach to investing, the distinction remains key for understanding which indexes will likely perform.
Analysts broadly agree that the Fed was overzealous in their tightening efforts in 2022, much the same way that they were overly accommodating in 2020. With historically high corporate and sovereign debt levels and inflation forecasts having begun receding towards the end of 2022, it will be increasingly unpalatable for the Fed to remain as intent on tightening this year. This might be good news for current bond holders, as instruments purchased at higher yields will increase in value should prevailing rates decline towards year’s end.
For equity markets, the key question is whether investors will again be drawn to Growth sectors should yields decline and risk assets become more attractive. Certainly, lower yields and lower inflation would begin to nudge this behaviour, although likely not as much as before given the Fed having showed a strong willingness to act should inflation resurface. In fact, for a strong Growth rebound to happen this year with similar fervour as in the distant pre-Covid past, the stars would have to align on several fronts, not least of which include a soft landing (markedly lower global inflation outlook without significant GDP contraction), and an accommodating Fed (who might be less eager to bring back the punch bowl prematurely as they did in 2020).
Lest we forget, stranger things have happened in the recent past, although one might be tempted to conclude that Value-oriented sectors and industries might be more likely to continue performing strongly in the year to come. This should bode well for our local equity indexes, as well as emerging market indexes like India and China.
While these points will remain debatable over the coming year, what is certain and timeless is the importance of ensuring one’s portfolio is properly diversified across different sources of return and risk. Investors will be well advised to enquire as to the appropriate index or multi-asset solutions that provide said diversification, and not simply hope that the number of instruments in a portfolio ensures real diversification is achieved.
Disclosure
Satrix consists of the following authorised FSPs: Satrix, a division of Sanlam Investment Management (Pty) Ltd, Satrix Managers (RF) (Pty) Ltd and Satrix Investments (Pty) Ltd in terms of the Financial Advisory and Intermediary Services Act (FAIS). The information does not constitute advice as contemplated in FAIS. Use or rely on this information at your own risk. Consult your Financial Adviser before making an investment decision. While every effort has been made to ensure the reasonableness and accuracy of the information contained in this document (“the information”), the FSP’s, its shareholders, subsidiaries, clients, agents, officers and employees do not make any representations or warranties regarding the accuracy or suitability of the information and shall not be held responsible and disclaims all liability for any loss, liability and damage whatsoever suffered as a result of or which may be attributable, directly or indirectly, to any use of or reliance upon the information.


