
Over the last few weeks, I’ve been approached by various people seeking my perspective on the recent market turmoil, particularly in the US, where that market was down almost 6% since the end of 2024[1],, and down 10% since its peak almost a month ago[2],. Investors seeing their portfolios decline in value may be questioning whether their current strategy is still right, or if a change is needed.
I always begin by asking what the investor is aiming for and how long they have to reach that goal. While other factors matter, this is the key determinant of whether their strategy is still appropriate.
What we do know is that, over longer periods, markets behave more predictably. However, any prediction still carries a high degree of uncertainty due to unpredictable shifts in the investment, regulatory, inflation, and geopolitical landscapes. So, what can investors do to better reach their goals?
- Match your investment term with the right mix of asset classes
- Diversify your strategy – it’s one of the only free lunches in investing
- Manage your costs
The principle is simple: riskier asset classes should be held for longer periods to pay off. In the short term, they are more volatile, but over time, their value should align more with fundamentals. Higher returns for taking on more risk make sense in the long run.
Charts comparing asset classes since January 2007 show that some, like local inflation-linked bonds (yellow) or nominal bonds (orange), have a narrower range of returns over all three-year periods, offering more certainty. In contrast, other asset classes show a much wider range of outcomes, providing less certainty over the same period.
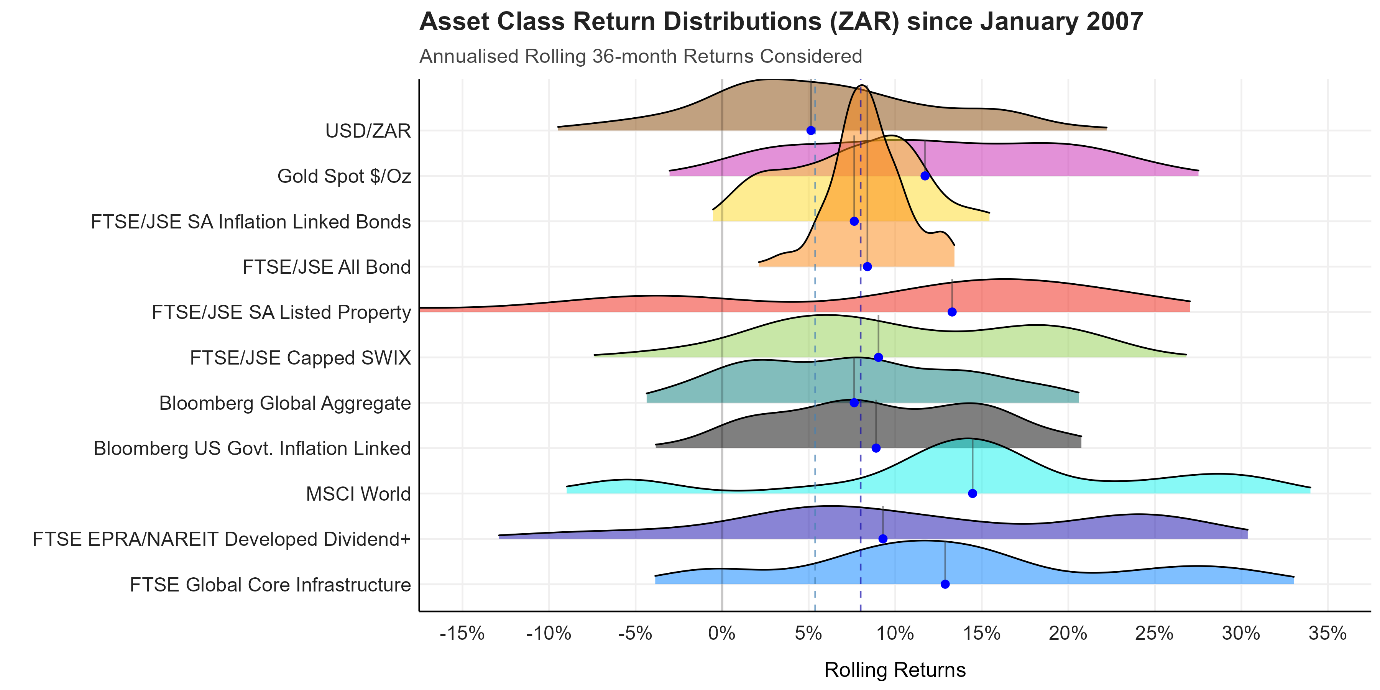
Figure 1: Asset Class Return Distributions (ZAR), annualised rolling three-year periods
Source: Satrix, as at 28 February 2025
[1] Source: S&P 500 Index, USD net total return, as at 13 Mar 2025
[2] Source: S&P 500 Index, USD net total return, 19 Feb 2025 – 13 Mar 2025

Figure 2: Asset Class Return Distributions (ZAR), annualised rolling seven-year periods
Source: Satrix, as at 28 February 2025
The purpose of showing these charts is not to provide an expectation of the return for each asset class – past performance is no guarantee of future results – but to show why more time is necessary when investing in riskier asset classes. It also shows that in most cases, but not always, more risk is generally compensated with higher returns.
Diversify Your Investment Strategy
Both within each asset class, and across asset classes, diversification allows you to reduce idiosyncratic risk to a minimum, so you’re only left with systemic risk. As one of my colleagues likes to say, “Volatility (or systemic risk), is a feature of investing, not a bug!” The only way to really manage this risk is to ensure you invest for a suitably sufficient time frame, which gives your investment time to reward you for your patience and for taking the risk.
An example of diversifying your risk would be not to hold only US equity exposure, but include broader developed market exposure in your portfolio, such as tracking the MSCI World Index. While this index is still heavily dominated by the US, it also includes exposure to Europe, Asia and Australasia. You could also consider investing beyond developed equity markets, by, for example tracking emerging market equities, which, over the same year-to-date period, are up over 3%[3]. Some of the performance delivered by indices outside of the US equity market year-to-date, over the relatively short period, show how differently markets can behave, and why you don’t want all your eggs in one basket[4]:
[3] Source: MSCI Emerging Markets Index, USD net total return, as at 13 March 2025
[4] Source: Index Providers, USD net total return, as at 13 March 2025
- MSCI China: 16.7%
- MSCI Europe: 12.2%
- FTSE Global Core Infrastructure: 2.4%
- Bloomberg Global Aggregate: 2.4%
- Bloomberg US Government Inflation-Linked Bond: 2.9%
Another factor to carefully consider is currency exposure. The above global indices are all denominated in US dollars. When converted to rand, which has strengthened relative to the US dollar, these US dollar-denominated returns have faced headwinds, while our local equity market is up 3.6% in rands[5], or 5.3% in US dollars.
It is tempting to believe that what has worked for the last 10 years will continue to work for the next ten. However, markets do eventually respond to longer-term fundamentals, meaning expensive markets and asset classes are more likely to underperform their undervalued counterparts. We accounted for this when reviewing the Strategic Asset Allocation for our range of multi-asset funds. Our analysis indicated US equity markets were expensive, so instead of allocating more capital to the expensive US equity market, we increased our allocation to emerging markets during our September 2024 rebalance.
So far, this overweight tilt in favour of emerging markets relative to the MSCI All Country World Index (ACWI) – which includes exposure to both developed and emerging markets – has paid off well. As has our exposure to global listed infrastructure, which acts as a more defensive equity play. The global listed infrastructure index that we track selects companies that operate infrastructure assets, whose revenue is often directly linked to inflation, providing a highly predictable long-term revenue stream, regardless of market or economic conditions.
Similarly, our recently launched Satrix Global Balanced FoF ETF (ticker: STXGLB) – the first of its kind on the Johannesburg Stock Exchange – has overweight exposure to emerging markets and a material allocation (10%) to global listed infrastructure, which has helped soften the impact to the US sell-off.
Manage Your Costs
I think about investment costs in relation to the expected real return. A low-risk investment, like a money market fund, may outperform inflation slightly over one-three years. However, when investing for growth above inflation, costs should be considered relative to that goal. For instance, a high-equity balanced fund might be expected to deliver a 5% real return above inflation (before costs), but if it costs 1.5%, plus 0.5% for platform access, the total cost is 2%. This means the cost is 40% of the expected return. It’s no wonder investors are left disappointed when they achieve only 3% real growth, having expected 5%. The impact of compounding, especially the negative effect of fees, is significant over the long term, so managing costs is crucial.
A similar balanced fund with a cost structure of 0.50% and accessed through the same platform, would now only cost 1% or 20% of your expected return, leaving you with 4% real growth.
When investing for the long term, market corrections and drawdowns are inevitable. Staying the course and resisting the urge to make drastic changes to a well-thought-out strategy is more likely to help you reach your investment goals on time, rather than constantly realigning your entire portfolio. Eventually, the market smooths out, allowing you to reach your destination as planned. As it turns out, the S&P 500 has recovered somewhat since 13 March 2025, and is now only down 1.7% as at 24 March 2025. Avoiding the urge to act, often at the most inopportune time, is a discipline that has shown to serve investors well.
[5] Source: FTSE/JSE Capped All Share Index, ZAR gross total return, as at 13 March 2025
Disclaimer
*Satrix is a division of Sanlam Investment Management
Satrix Managers (RF) (Pty) Ltd is an approved financial service provider in terms of the Financial Advisory and Intermediary Services Act, No 37 of 2002 (“FAIS”). The information above does not constitute financial advice in terms of FAIS. Consult your financial adviser before making an investment decision. While every effort has been made to ensure the reasonableness and accuracy of the information contained in this document (“the information”), the FSP, its shareholders, subsidiaries, clients, agents, officers and employees do not make any representations or warranties regarding the accuracy or suitability of the information and shall not be held responsible and disclaim all liability for any loss, liability and damage whatsoever suffered as a result of or which may be attributable, directly or indirectly, to any use of or reliance upon the information.
Satrix Managers (RF) (Pty) Ltd (Satrix) is a registered and approved Manager in Collective Investment Schemes in Securities. Collective investment schemes are generally medium- to long-term investments. With Unit Trusts and ETFs, the investor essentially owns a “proportionate share” (in proportion to the participatory interest held in the fund) of the underlying investments held by the fund. With Unit Trusts, the investor holds participatory units issued by the fund while in the case of an ETF, the participatory interest, while issued by the fund, comprises a listed security traded on the stock exchange. ETFs are index tracking funds, registered as a Collective Investment and can be traded by any stockbroker on the stock exchange or via Investment Plans and online trading platforms. ETFs may incur additional costs due to being listed on the JSE. Past performance is not necessarily a guide to future performance and the value of investments / units may go up or down. A schedule of fees and charges, and maximum commissions are available on the Minimum Disclosure Document or upon request from the Manager. Collective investments are traded at ruling prices and can engage in borrowing and scrip lending. Should the respective portfolio engage in scrip lending, the utility percentage and related counterparties can be viewed on the ETF Minimum Disclosure Document. A fund of funds portfolio is a portfolio that invests in portfolios of collective investment schemes that levy their own charges, which could result in a higher fee structure for the fund of funds. International investments or investments in foreign securities could be accompanied by additional risks such as potential constraints on liquidity and repatriation of funds, macroeconomic risk, political risk, foreign exchange risk, tax risk, settlement risk as well as potential limitations on the availability of market information.
For more information, visit https://satrix.co.za/products
Related Content
18 March 2025
What’s Trumps in a Topsy-Turvy World?

The post-war economic order, once a symbol of stability, now appears fragile. Investors face the challenge of navigating a world where traditional assumptions about safety and opportunity are being disrupted.
11 March 2025
Newsletter | March 2025 | The China Story: Outshining Global Markets

Our newsletter looks at how China's AI advancements drove market growth, while policy support boosts investor sentiment.